
HR leaders no longer win budget with good intentions. They win it with numbers that hold up in the boardroom. The question is not whether wellbeing matters, but how to measure what burnout, turnover, and disengagement are costing, and what targeted programs could return.
This guide explains the logic behind a wellbeing ROI model built around three measurable drivers: absenteeism, turnover, and productivity. It also shows where to find the inputs you already have, and how to present a result that is credible to finance.
Why quantify wellbeing at all
Two things are true at the same time. Employees in the UAE report high stress and widespread burnout symptoms, which erodes performance and trust. At the same time, leaders want a clear line of sight from wellbeing to business outcomes. In the UAE, 89% of respondents reported stress and 99% reported at least one burnout symptom in a 2024 study summarized by The National and mentl.space.
Globally, low engagement is not a “soft” issue. Gallup estimates it drains about 9% of world GDP in lost productivity, a headline figure they put at US$8.9 trillion. When you translate these macro signals into your company’s numbers, the business case sharpens.

The model that finance will understand
A practical ROI view starts with three cost buckets that are easy to explain and defend.
1. Absenteeism
Days not worked because of illness or stress have a direct wage cost and a knock-on effect on delivery. The simplest input is your absenteeism rate and average daily cost per employee. If you do not track this, use a clear formula:
Absenteeism rate = (Total days absent ÷ Total available workdays) × 100
2. Turnover
Replacing people is expensive. Gallup’s 2024 retention analysis estimates replacement costs of roughly 200% of salary for leaders and managers, 80% for technical professionals, and 40% for frontline roles. These tiers help you avoid “one number fits all” assumptions when you model savings from reduced churn.
Turnover rate = (Number of leavers ÷ Average number of employees) × 100
3. Productivity and engagement
Presenteeism and disengagement are the hidden sinkholes. Gallup’s 2024 global analysis ties low engagement to a multi-trillion productivity loss, which is why even modest changes in engagement can have outsized financial effects. If you do not have an internal engagement score, you can still model directional impact by applying small, realistic improvements to a conservative baseline and monetizing the recovered hours.
Your inputs, simplified
You do not need perfect data to get a useful answer. You need defendable assumptions.
Absenteeism
Pull days lost from payroll or HRIS. If that is not available, start with your policy data and team-level records and use the formula above.
Turnover
Use actual leavers in the last 12 months and segment by role family if you can. Apply the Gallup replacement cost ranges to each segment rather than using a single average.
Engagement / productivity
If you lack survey data, be transparent and use a benchmark as a placeholder, then stress-test the sensitivity. Your finance partner will appreciate seeing the band, not a single optimistic point. For context, Gallup’s recent reporting shows engagement remains low and volatile, with significant economic impact.
How the calculator turns cost into ROI
Once you enter your rates and unit costs, a credible calculator will:
Quantify current cost across absenteeism, turnover, and productivity leakage.
Apply evidence-based improvement ranges to each driver to show potential savings after a structured program.
Return an ROI using the standard formula:
ROI = (Projected savings − Program cost) ÷ Program cost
Two examples of how the levers work in practice:
- Reducing avoidable turnover among supervisors by even a few points can unlock outsized savings because replacement costs at that level run close to two times salary.
- Improving team engagement from a very low baseline yields productivity gains that finance already recognizes in other contexts, which is why Gallup connects engagement gaps to GDP-scale losses.
Regional reality check
Numbers land better when they match lived experience. In the UAE, employees report high stress and “always on” work patterns, which increase the likelihood of off-hours activity and poor recovery. Use that context when you frame assumptions with leadership. If your workforce includes high-stress roles or split office–frontline teams, do not average them together. Model them separately so savings are not diluted.
What to avoid when you present ROI
- Single heroic assumptions. Show a low, base, and high case.
- Global stats without a bridge. Pair global evidence with your own rates so it feels specific, not generic.
- Treating all roles the same. Use the tiered replacement costs so the model reflects your mix.
- Hiding data gaps. If you do not have a measure, name it and show how you estimated. Finance prefers a clear estimate to a vague claim.

How to get started in under 30 minutes
1. Pull last year’s leavers and rough average salaries by role family.
2. Export absence days and confirm your working-day baseline.
3. Choose an engagement proxy if you do not have a score yet, then run a sensitivity test.
4. Run the model and save three scenarios: conservative, expected, stretch.
5. Book time with finance to review the logic, not just the headline number.
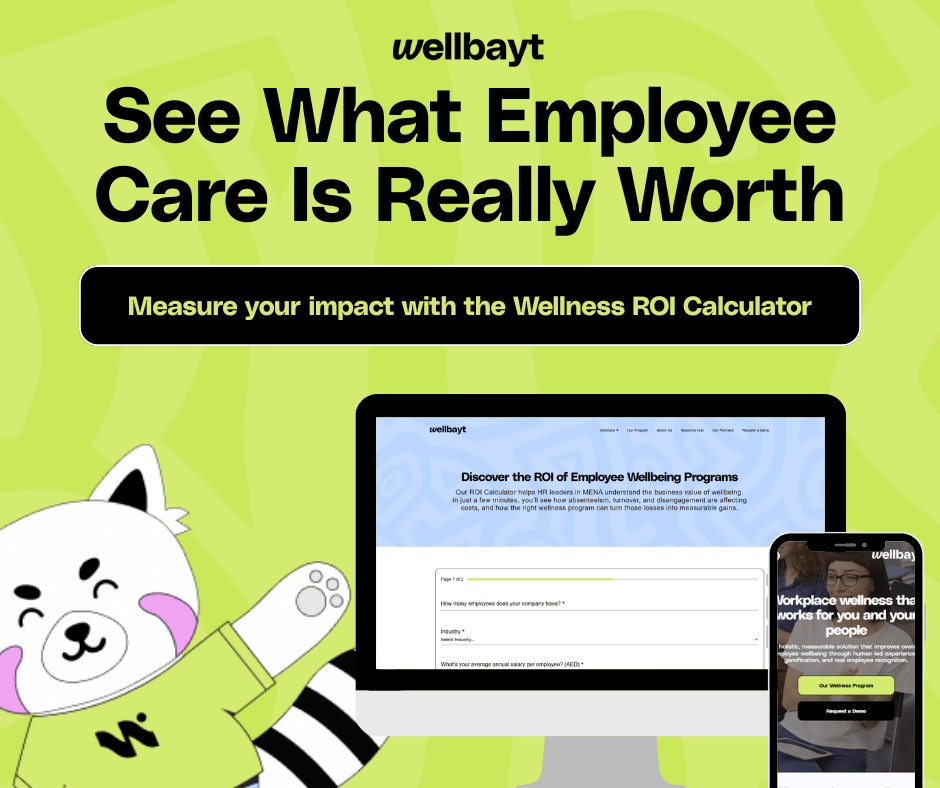
Try a quick, directional run using a tool that blends your inputs with regional benchmarks: Wellness ROI Calculator. It estimates cost from absenteeism, turnover, and disengagement, then shows potential savings after a structured program. (Directional, not a financial audit.)
The takeaway for HR
Wellbeing ROI is not a pitch but a translation. When you convert stress, churn, and disengagement into cost and recovered value, decision-makers can see what care is worth in business terms. That opens the door to fund what actually helps.
Talk to us
If you want help pressure-testing your inputs or tailoring the model to frontline and leadership roles, our team can walk your finance partner through the logic and the scenarios.